Volatility describes how unevenly returns may be distributed across many rounds, while hit frequency and paytable structure describe the specific mechanics behind that distribution. These three measures cover different questions, and combining them gives a clearer picture of a game than any single label. The full context for low and high volatility pokies shows how these metrics sit together in a practical comparison.
A pokie can carry the same volatility label as another title while producing very different session patterns. Hit frequency and paytable concentration help explain why.
Hit frequency counts winning rounds
Hit frequency is the theoretical share of spins that produce any listed payout. It can include returns smaller than the stake. A $1 spin returning $0.30 registers as a hit even though the balance fell by $0.70.
This distinction matters when reading marketing descriptions. A high hit frequency can coexist with frequent balance reductions if most hits return only a fraction of the wager.
Hit frequency data appears in some provider information panels, third-party databases or published game sheets. Where it is available, it adds a useful rhythm indicator alongside volatility.
Paytable shape shows where the value is concentrated
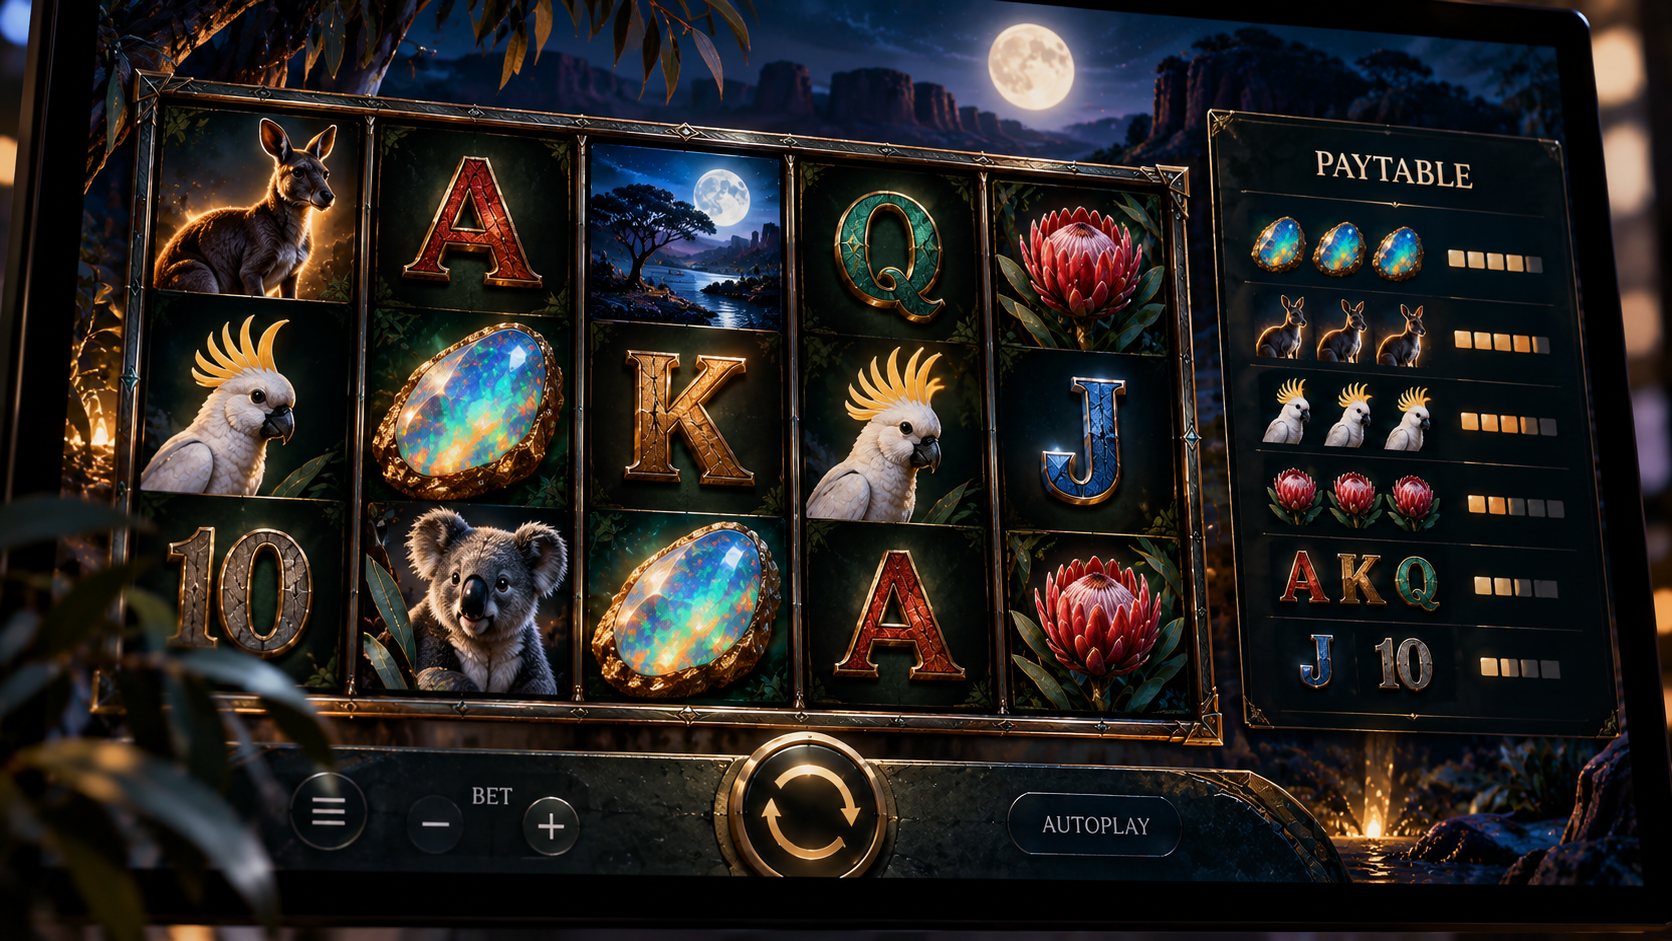
A paytable lists the prizes available from each symbol combination. The relationship between common symbol prizes and top prizes reveals how concentrated the game’s value is.
A wide paytable distributes prizes across many symbol levels. A narrow paytable concentrates most return in rare combinations or feature events. Two games with identical RTP can have very different paytable shapes.
| Paytable type | Common symbol prizes | Top prizes | Typical character |
| Wide distribution | Moderate | Moderate | Frequent mid-range results |
| Concentrated | Low | Very high | Rare large results |
| Balanced | Low-moderate | High | Mixed base and feature value |
Reading the paytable before play reveals this structure directly. The ratio between a common three-symbol prize and the top five-symbol prize gives a quick indication of how concentrated the design is.
RTP, hit frequency and paytable shape answer different questions
| Measure | What it describes | Where to find it |
| RTP | Theoretical long-run return percentage | Information panel, provider sheet |
| Volatility | How unevenly returns may be distributed | Label, scale or informal description |
| Hit frequency | Share of rounds producing any listed payout | Provider panel (when published) |
| Paytable shape | Distribution of prize value across combinations | Paytable screen |
Each measure adds a different dimension. RTP helps compare long-run cost. Volatility describes general swing pattern. Hit frequency indicates rhythm. Paytable shape shows where the value sits.
Feature events can hold a large share of total return
Many modern pokies allocate a significant portion of theoretical return to free spins, bonus rounds or jackpot events. The base game may produce many small hits while the bulk of value awaits a trigger.
Providers including Endorphina, 3 Oaks and Hacksaw Gaming often publish separate RTP breakdowns showing base game and feature contribution. When available, this split clarifies how much of the theoretical return depends on reaching the feature.
A game allocating 40% of its theoretical return to a bonus round will produce a different session pattern from one allocating 10%, even at the same headline RTP and volatility label.

Practical steps before opening a title
A useful pre-play review can follow four steps:
- Open the information panel and record the RTP, volatility label and stake range;
- Check the paytable for the ratio between common symbol prizes and the top combination;
- Note if a feature interval or hit frequency figure is published;
- Identify what share of the return sits in the base game versus features where that data is available.
This review takes only a few minutes and converts a title from an unknown into a described game structure.
Demo play as a controls check
Demo mode is useful for learning button placement, feature rules and animation pace. A short free-play session can show the interface clearly.
Demo results give limited information about the game’s long-run distribution. A generous or quiet sample of 50 to 100 rounds reflects chance more than the underlying structure. The information panel and paytable remain more reliable for comparison.
Applying the measures to a session
Hit frequency and paytable shape become most useful when comparing two titles that share a volatility label or RTP. A high-volatility game with many small base hits and a large feature allocation behaves differently from one where even base symbols produce rare medium prizes.
Australian players can use these measures as a comparison layer alongside volatility and RTP. The combination supports a more informed selection before real money is committed, and each measure stays within its proper role as a description of game structure.